
by Michael De Lorenzo – CTO
CMP.LY is a venture-funded startup offering social media monitoring, measurement, insight and compliance solutions. Our clients include Fortune 100 financial services, automotive, consumer packaged goods companies, as well as leading brands, advertising, social and PR agencies.
Our patented monitoring, measurement and insight (MMI) tool, CommandPost provides real-time, actionable insights into social performance. Its structured methodology, unified cross-platform reporting and direct channel monitoring capabilities ensure marketers can capture and optimize the real value of their engagement, communities and brand advocates. All of CommandPost’s products have built-in compliance solutions including plain language disclosure URLs (such as rul.es, ter.ms, disclosur.es, paid-po.st, sponsored-po.st and many others).
MongoDB at CMP.LY
At CMP.LY, MongoDB provides the data backbone for all of CommandPost’s social media monitoring services. Our monitoring services collect details about social media content across multiple platforms, all engagements with that content and builds profiles around each user that engages. This amounts to thousands of writes hitting our MongoDB replica set every second across multiple collections. While our monitoring services are writing new and updated data to the database in the background, our clients are consuming the same data in real-time via our dashboards from those same collections.
More Insights Mean More Writes
With the launch of CommandPost, we expanded the number of data points our monitoring services collected and enhanced analysis of those we were already collecting. These changes saw our MongoDB deployment come under a heavier load than we had previously seen – especially in terms of the number of writes performed.
Increasing the number of data points collected also meant we had more interesting data for our clients to access. From a database perspective, this meant more reads for our system to handle. However, it appeared we had a problem – our API was slower than ever in returning the data clients requested.
We had been diligent about adding indexes and making sure the most frequent client-facing queries were covered, but reads were still terribly slow. We turned to our MongoDB Management Service dashboard for clues as to why.
MongoDB Management Service
By turning to MMS, we knew we would have a reliable source to provide insight into what our database was doing both before and after our updates to CommandPost. Most (if not all) of the stats and charts we typically pay attention to in MMS looked normal for our application and MongoDB deployment. As we worked our way through each metric, we finally came across one that had changed significantly – Lock Percentage.
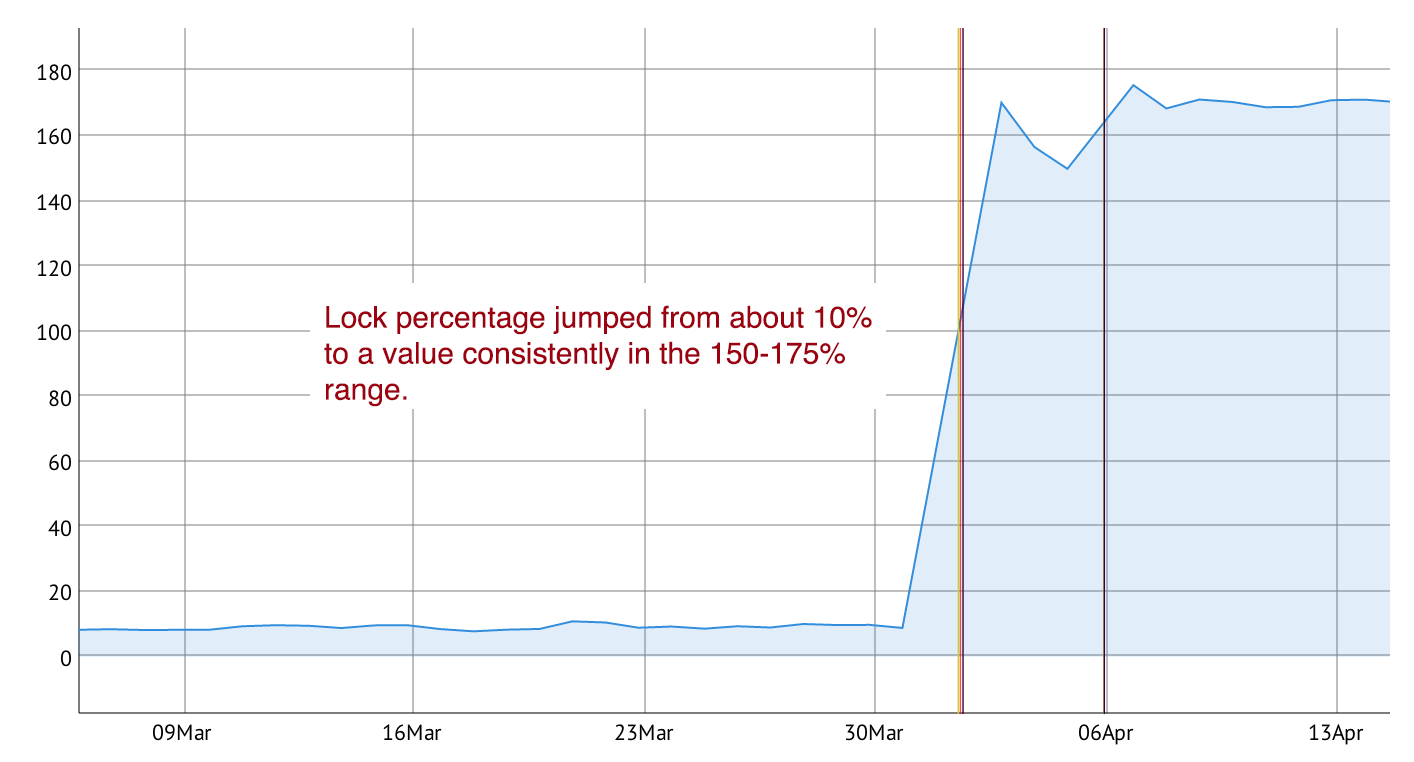
Since releasing the latest updates to CommandPost, our deployment’s primary client-serving database saw its lock percentage jump from about 10% to a constant rate of 150-175%. This was a huge jump with a very negative impact on our application – API requests timed out, queries took minutes to complete and our client-facing applications became nearly unusable.
Why Is Lock Percentage Important?
A quick look at how MongoDB handles concurrency tells us exactly why Lock Percentage became so important for us.
MongoDB uses a readers-writer lock that allows concurrent reads access to a database but gives exclusive access to a single write operation. When a read lock exists, many read operations may use this lock. However, when a write lock exists, a single write operation holds the lock exclusively, and no other read or write operations may share the lock.
Locks are “writer greedy,” which means writes have preference over reads. When both a read and write are waiting for a lock, MongoDB grants the lock to the write. As of version 2.2, MongoDB implements locks at a per-database granularity for most read and write operations.
The “greediness” of our writes was not only keeping our clients from being able to access data (in any of our collections), but causing additional writes to be delayed.
Strategies to Reduce Lock Contention
Once we identified the collections most affected by the locking, we identified three possible remedies to the issue and worked to apply all of them.
Schema Changes
The collection that saw our greatest load (in terms of writes and reads) originally contained a few embedded documents and arrays that tended to make updating documents hard. We took steps to denormalize our schema and, in some cases, customized the _id attribute. Denormalization allowed us to model our data for atomic updates. Customizing the _id attribute, allowed us to simplify our writes without additional queries or indexes by leverage the existing index on the document’s _id attribute. Enabling atomic updates allowed us to simplify our application code and reduce the time spent in application write lock.
Use of Message Queues
To manage the flow of data, we refactored some writes to be managed using a Publish-Subscribe pattern. We chose to use Amazon’s SQS service to do this, but you could just as easily use Redis, Beanstalkd, IronMQ or any other message queue.
By implementing message queuing to control the flow of writes, we were able to spread the frequency of writes over a longer period of time. This became crucially important during times where our monitoring services came under higher-than-normal load.
Multiple Databases
We also chose to take advantage of MongoDB’s per database locking by creating and moving write-heavy collections into separate databases. This allowed us to move non-client-facing collections into databases that didn’t need to be accessed by our API and client queries.
Splitting into multiple databases meant that only the database taking on an update needed to be locked, leaving all other databases to remain available to serve client requests.
How Did Things Change?
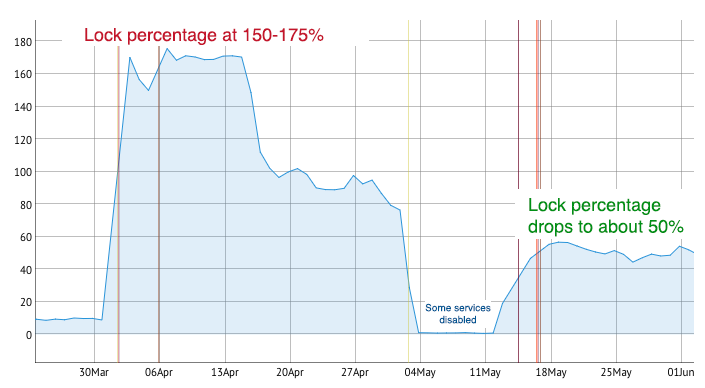
The aforementioned changes yielded immediate results. The results were so drastic that many of our users commented to us that the application seemed faster and performed better. It wasn’t their imaginations – as you can see from the “after” Lock Percentage chart below, we reduced the value to about 50% on our primary client-serving database.
What’s Next?
In working with MongoDB Technical Services, we also identified one more strategy we intend to implement to further reduce our Lock Percentage – Sharding. Sharing will allow us to horizontally scale our write workload across multiple servers and easily add additional capacity to meet our performance targets.
We’re excited about the possibility of not just improving the performance of our MongoDB deployment, but offering our users faster access to their data and a better overall experience using CommandPost.
If you want to learn more about how to use MongoDB Management Service to identify potential issues with your MongoDB deployment, keep it healthy and keep your application running smoothly, attend my talk “Performance Tuning on the Fly at CMP.LY” at MongoDB World in New York City, on Tuesday, June 24th at 2:20pm in the New York East Ballroom.